Galaxy Colours: Difference between revisions
| (9 intermediate revisions by the same user not shown) | |||
| Line 2: | Line 2: | ||
===Filters | ===Optical to nearIR Filters=== | ||
[[File:Hsc2017.png]] | [[File:Hsc2017.png|300px]] | ||
[[File:VISTA-filters.jpg|300px]] | |||
[[File:VISTA-filters.jpg]] | |||
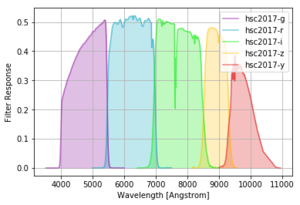
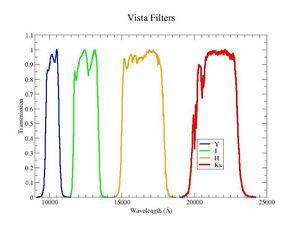
When we refer to colours we usually mean a combination of these filters to highlight whether a galaxy (or star) spectrum is "red" or "blue". This is also akin to the HR diagram for stars, which uses colours an an indicator of e.g. Temperature. | When we refer to colours we usually mean a combination of these filters to highlight whether a galaxy (or star) spectrum is "red" or "blue". This is also akin to the HR diagram for stars, which uses colours an an indicator of e.g. Temperature. | ||
| Line 19: | Line 17: | ||
The most common plot in extragalactic astrophysics, is the colour-magnitude diagram, which plots a colour (blue-red filter) against a magnitude in one of the filters. The y-axis is then the colour and the x-axis is the brightness. | The most common plot in extragalactic astrophysics, is the colour-magnitude diagram, which plots a colour (blue-red filter) against a magnitude in one of the filters. The y-axis is then the colour and the x-axis is the brightness. | ||
[[File:Galaxy_color-magnitude_diagram.jpg|400px]] | [[File:Galaxy_color-magnitude_diagram.jpg|300px]] | ||
[[File:Redspiral_colourmagnitude.jpg|400px]] Taken from [https://blog.galaxyzoo.org/2012/05/09/my-favourite-colour-magnitude-diagram/ GalaxyZoo]. | |||
===Galaxy colour-colour diagram=== | ===Galaxy colour-colour diagram=== | ||
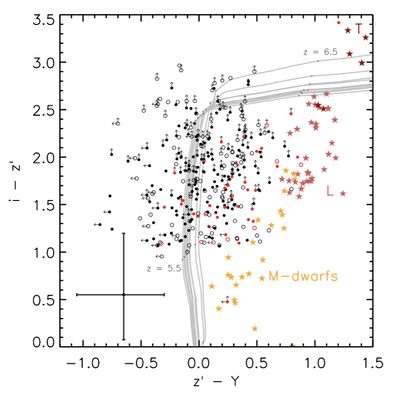
But you will also see colour-colour diagrams, which are often used to select certain galaxies at certain redshifts as they can pin-point where there are "breaks" in the galaxy spectral energy distribution. | But you will also see colour-colour diagrams, which are often used to select certain galaxies at certain redshifts as they can pin-point where there are "breaks" in the galaxy spectral energy distribution. | ||
[[File:LBGselection.jpg |400px]] | |||
Example of a colour-colour diagram to select high-redshift z>6 galaxies based on their Lyman-break. Taken from [https://arxiv.org/pdf/1411.2976.pdf Bowler et al. (2015)]. | |||
Latest revision as of 09:32, 19 November 2020
Galaxy Colours
Optical to nearIR Filters
When we refer to colours we usually mean a combination of these filters to highlight whether a galaxy (or star) spectrum is "red" or "blue". This is also akin to the HR diagram for stars, which uses colours an an indicator of e.g. Temperature.
Combining these you can see how they can be used to understands the SEDs of various objects
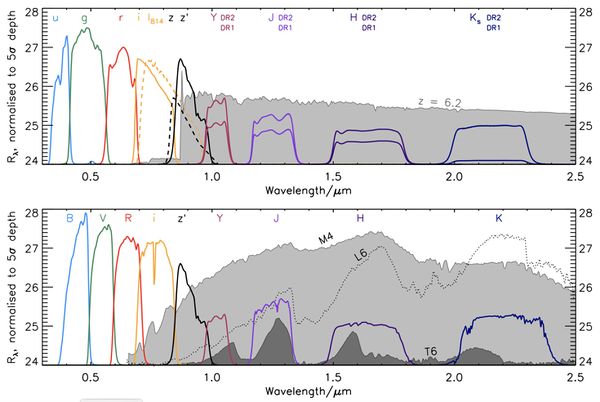 Taken from Bowler et al. (2015).
Galaxy colour-magnitude diagram
The most common plot in extragalactic astrophysics, is the colour-magnitude diagram, which plots a colour (blue-red filter) against a magnitude in one of the filters. The y-axis is then the colour and the x-axis is the brightness.
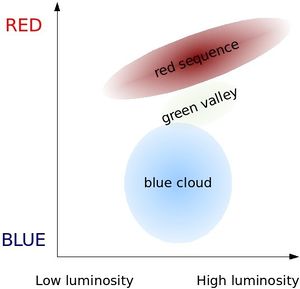
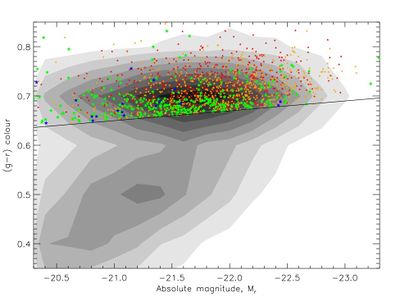 Taken from GalaxyZoo.
Galaxy colour-colour diagram
But you will also see colour-colour diagrams, which are often used to select certain galaxies at certain redshifts as they can pin-point where there are "breaks" in the galaxy spectral energy distribution.
Example of a colour-colour diagram to select high-redshift z>6 galaxies based on their Lyman-break. Taken from Bowler et al. (2015).
