Galaxy Colours: Difference between revisions
Jump to navigation
Jump to search
| Line 1: | Line 1: | ||
==Galaxy Colours== | ==Galaxy Colours== | ||
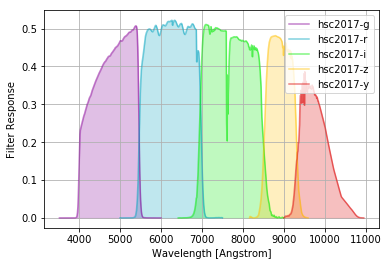
=Filters in HyperSuprimeCame on Subaru= | ===Filters in HyperSuprimeCame on Subaru=== | ||
[[File:Hsc2017.png]] | [[File:Hsc2017.png]] | ||
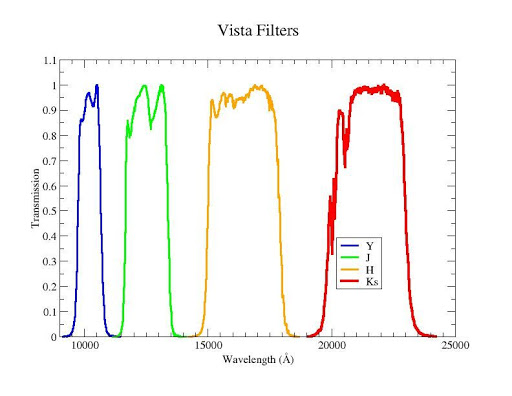
===Near-infrared filters on VISTA=== | ===Near-infrared filters on VISTA=== | ||
[[File:VISTA-filters.jpg]] | [[File:VISTA-filters.jpg]] | ||
When we refer to colours we usually mean a combination of these filters to highlight whether a galaxy (or star) spectrum is "red" or "blue". This is also akin to the HR diagram for stars, which uses colours an an indicator of e.g. Temperature. | |||
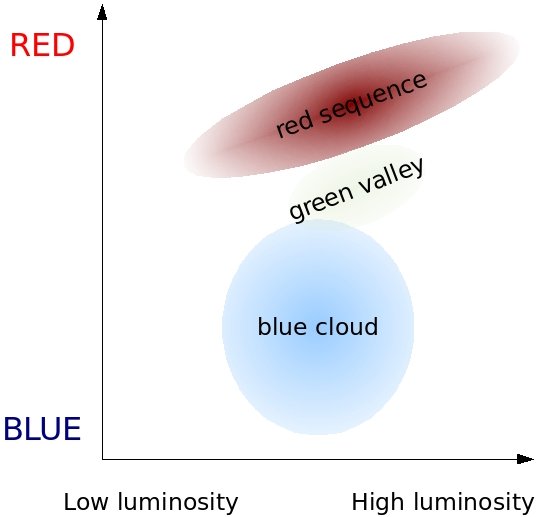
===Galaxy colour-magnitude diagram=== | |||
The most common plot in extragalactic astrophysics, is the colour-magnitude diagram, which plots a colour (blue-red filter) against a magnitude in one of the filters. The y-axis is then the colour and the x-axis is the brightness. | |||
[[File:Galaxy_color-magnitude_diagram.jpg]] | |||
Revision as of 08:43, 19 November 2020
Galaxy Colours
Filters in HyperSuprimeCame on Subaru
Near-infrared filters on VISTA
When we refer to colours we usually mean a combination of these filters to highlight whether a galaxy (or star) spectrum is "red" or "blue". This is also akin to the HR diagram for stars, which uses colours an an indicator of e.g. Temperature.
Galaxy colour-magnitude diagram
The most common plot in extragalactic astrophysics, is the colour-magnitude diagram, which plots a colour (blue-red filter) against a magnitude in one of the filters. The y-axis is then the colour and the x-axis is the brightness.


